Now that we have recorded actual data on how our gum bichromates will print we can use that data to make a negative transparency which gives us a full scale and the correct values for each of the zones in the scale. Image editing programs have a tool called 'Curves' which translates image values to other image values using inputs and outputs. When we inverted our negative earlier, we were actually using a very simple curve. We will be making our own curves this time. This will make more sense in a bit if you feel a little lost.
Relative Scale
First, however, our average values aren't quite what we need yet. We need
to convert them into a full scale range. Right now in my example the darkest
value is 59 and the brightest is 179. If you subtract them you find the value
is 120. We need this to be stretched out so that it goes from 0 to 255 like
our other scales, otherwise we will put bad data in our curve and end up with
wonky negatives! Effectively we need to get rid of however light or dark our
scanner may have scanned our print.
In another column we need to make a "relative values" scale based upon our average values. This is the equation that will be needed in each cell:
((average A&B value)-(lowest value)) * 255/(highest - lowest)
It looks messy. In my example I see my lowest avg value is 59. The difference between the highest(179) and lowest(59) value is 120. In the first cell my equation would then be:
=(F5-59)*255/120 where F5 is the average value next to it.
If you get the equation right, the next column will start at 0 and climb to 255 as you can see in the yellow in my example. This is your print's relative scale, treating the brightest part of the scale as if it were pure white, and the darkest as if it were pure black. All the values in between fall into place.
Making the Scale
Next, we need to figure out what values to put into our curve. Looking at
our spreadsheet, we can see that certain values of our negative printed as
specific values in our print. In my example we can see zone 5 has an rgb value
of 128, when inverted becomes 127 on my transparency and that value of 127
prints as 92, and finally its relative value is 70.
Just as we had observed earlier, zone 5 (which is supposed to be middle gray, a rgb value of 128) is printing much darker at an rgb value of 70.
Values on our transparencies become values in gum bichromate
Now we get to the whole point of all this! Since we now know from my example a value of 127 on a negative will print as 70 in a print, we can tell photoshop or gimp to print any dark gray in an image with a value of 70 as 128. Similarly we could do this with all the values.
In photoshop open any image so that the 'adjustments' menu option becomes
available. Go to Image>Adjustments>Curves... to open the curves dialogue
box.
In Gimp open any image. Go to Colors>Curves... to open the curves dialogue
box.
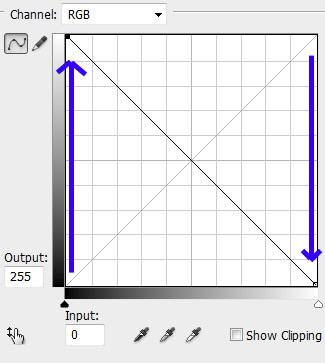
Click and drag both handles on either end of the curve to invert the curve. You are telling curves to turn all values of 0 into 255 and all values of 255 to become 0.
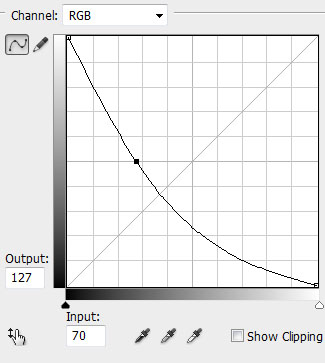
Now start with zone 5. In my example I found values of 127 print as 70. Well then we want to tell our curves to make any values of 70 in our images into 127 on our negatives.
Click on the line and notice how the input output numbers change. You can move the handle until the values are input 70 and output 127. I find it easiest to use the arrow keys on the keyboard to move the handle around to get the desired placement.
In Gimp it is slightly different you have to drag the handle around and set the X value to 70 and the Y value to 127.
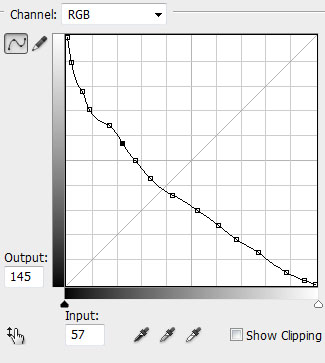
Proceed to add the rest of the zones to your curve. Remember the input values will be the relative scale values from your gum print and the output values will be the inverted zone values from your spread sheet. You do not have to use every value you measured. If an area looks wonky, use one of the half zones. If done correctly your curve should have an overall downward slope from left to right. It may look bumpy in parts, and not exactly smooth. But not to worry.
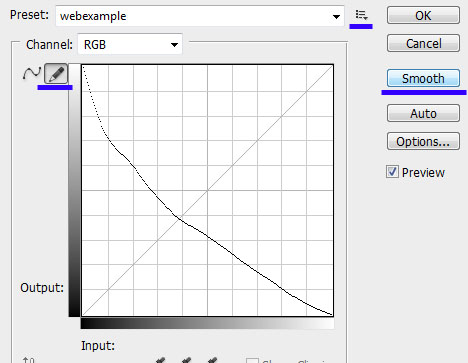
Finally, in photoshop hit the draw curve button that looks like a pencil. This allows you to then hit the 'Smooth' Button on the right which smooths out some of the odd bends in the scale. Only click smooth one time. Then go ahead and save your curve as a preset using the small menu icon just to the right of the preset names.
Give this curve a name like '2-4-8 Negative 1 Smooth' or something like
similar to indicate the exposure times used. We will use this scale in
the next section for a second test.